
在做项目的时候经常会遇到会使用各种各样的图表,在react项目中处理图标时使用echart-for-react包,他依赖于echarts包
安装:
npm install --save echarts


npm install --save echarts-for-react
引入并使用:
import ReactEcharts from 'echarts-for-react';


// render echarts option.

<ReactEcharts option={this.getOption()} />
options参数时必要的,就是你使用的echarts.setOption(option)中的配置参数。
首先举个栗子,我们的js文件:
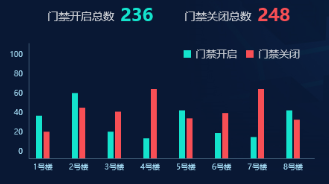
import React from 'react';

import ReactEcharts from 'echarts-for-react';

import S from './style.scss';

import PointLineTitle from 'layout/ui_components/pointLineTitle/PointLineTitle';


import barOption from './barOption';


const EntranceGuard = ()=>{

    return (

        <div className={S.entranceGuard}>

            <PointLineTitle title="门禁进出" />

            <div className={S.entranceData}>

                <p className={S.entranceOpenTotal}>门禁进入总数 <span>235</span></p>

                <p className={S.entranceCloseTotal}>门禁外出总数 <span>248</span></p>

            </div>

            <div className={S.barChart}>

                <ReactEcharts

                    option={barOption}

                    style={{width:'100%',height:'100%'}}

                />

            </div>

        </div>

    )

}


export default EntranceGuard;

 配置文件:barOptions.js


//柱状图配置

const barOption = {

    backgroundColor: 'transparent',

    tooltip: {

        trigger: 'axis',

        axisPointer: {

            type: 'shadow'

        }

    },

    legend: {

        data: ['门禁进入', '门禁外出'],

        align: 'left',

        top: 18,

        right: 20,

        textStyle: {

            color: "#c1c5cd"

        },

        itemWidth: 10,

        itemHeight: 10,

        itemGap: 12

    },

    grid: {

        top: '24%',

        left: '3%',

        right: '3%',

        bottom: '3%',

        containLabel: true

    },

    xAxis: [{

        type: 'category',

        data: [

            '1号楼',

            '2号楼',

            '3号楼',

            '4号楼',

            '5号楼',

            '6号楼',

            '7号楼',

            '8号楼',

        ],

        axisLine: {

            show: true,

            lineStyle: {

                color: "#45647f",

                width: 1,

                type: "solid"

            }

        },

        axisTick: {

            show: false,

        },

        axisLabel: {

            show: true,

            textStyle: {

                color: "#a1d8f1",

            }

        },

    }],

    yAxis: [{

        type: 'value',

        axisTick: {

            show: false,

        },

        axisLine: {

            show: true,

            lineStyle: {

                color: "#45647f",

                width: 1,

                type: "solid"

            },

        },

        splitLine: {

            show: false

        },

        axisLabel: {

            show: true,

            textStyle: {

                color: '#a1d8f1',

                fontSize: '12px'

            }

        }


    }],

    series: [{

        name: '门禁进入',

        type: 'bar',

        data: [20, 50, 80, 58, 83, 68, 57, 100],

        barWidth: 8, //柱子宽度

        // barGap: 1, //柱子之间间距

        itemStyle: {

            color: '#14e3cc'

        }

    }, {

        name: '门禁外出',

        type: 'bar',

        data: [50, 70, 60, 61, 75, 87, 60, 62],

        barWidth: 8,

        // barGap: 1,

        itemStyle: {

            color: '#f84f55'

        }

    }]

}


export default barOption;
效果图:
手动引入需要的echarts模块以减少打包文件的大小
import React from 'react';

// import the core library.

import ReactEchartsCore from 'echarts-for-react/lib/core';


// then import echarts modules those you have used manually.

import echarts from 'echarts/lib/echarts';

// import 'echarts/lib/chart/line';

import 'echarts/lib/chart/bar';

// import 'echarts/lib/chart/pie';

// import 'echarts/lib/chart/scatter';

// import 'echarts/lib/chart/radar';


// import 'echarts/lib/chart/map';

// import 'echarts/lib/chart/treemap';

// import 'echarts/lib/chart/graph';

// import 'echarts/lib/chart/gauge';

// import 'echarts/lib/chart/funnel';

// import 'echarts/lib/chart/parallel';

// import 'echarts/lib/chart/sankey';

// import 'echarts/lib/chart/boxplot';

// import 'echarts/lib/chart/candlestick';

// import 'echarts/lib/chart/effectScatter';

// import 'echarts/lib/chart/lines';

// import 'echarts/lib/chart/heatmap';


// import 'echarts/lib/component/graphic';

// import 'echarts/lib/component/grid';

// import 'echarts/lib/component/legend';

import 'echarts/lib/component/tooltip';

// import 'echarts/lib/component/polar';

// import 'echarts/lib/component/geo';

// import 'echarts/lib/component/parallel';

// import 'echarts/lib/component/singleAxis';

// import 'echarts/lib/component/brush';


import 'echarts/lib/component/title';


// import 'echarts/lib/component/dataZoom';

// import 'echarts/lib/component/visualMap';


// import 'echarts/lib/component/markPoint';

// import 'echarts/lib/component/markLine';

// import 'echarts/lib/component/markArea';


// import 'echarts/lib/component/timeline';

// import 'echarts/lib/component/toolbox';


// import 'zrender/lib/vml/vml';


// The usage of ReactEchartsCore are same with above.

<ReactEchartsCore

  echarts={echarts}

  option={this.getOption()}

  notMerge={true}

  lazyUpdate={true}

  theme={"theme_name"}

  onChartReady={this.onChartReadyCallback}

  onEvents={EventsDict}

  opts={} />

组件参数使用详解:

option (必需,对象)

echarts选项配置,请参见http://echarts.baidu.com/option.html#title。


notMerge (可选,对象)

何时setOption(不合并数据),默认值为false。请参阅http://echarts.baidu.com/api.html#echartsInstance.setOption。


lazyUpdate (可选,对象)

时setOption,懒惰型更新数据,默认为false。请参阅http://echarts.baidu.com/api.html#echartsInstance.setOption。


style (可选,对象)

在styleecharts股利。object,默认值为{height:'300px'}。


className (可选,字符串)

在classecharts股利。您可以通过类名称设置图表的CSS样式。


theme (可选,字符串)

该themeecharts的。string,则应registerTheme在使用它之前使用(主题对象格式:https : //github.com/ecomfe/echarts/blob/master/theme/dark.js)。例如


// import echarts

import echarts from 'echarts';

...

// register theme object

echarts.registerTheme('my_theme', {

  backgroundColor: '#f4cccc'

});

...

// render the echarts use option `theme`

<ReactEcharts

  option={this.getOption()}

  style={{height: '300px', width: '100%'}}

  className='echarts-for-echarts'

  theme='my_theme' />

onChartReady (可选,功能)
图表准备就绪后,将使用echarts object参数作为参数回调该函数。
loadingOption (可选,对象)
echarts加载选项配置,请参见http://echarts.baidu.com/api.html#echartsInstance.showLoading。
showLoading (可选,布尔值,默认值:false)
bool,在绘制图表时,显示加载蒙版。
onEvents (可选,array(string => function))
绑定echarts事件,将使用echarts event object和the echart object作为参数进行回调。例如:
let onEvents = {

  'click': this.onChartClick,

  'legendselectchanged': this.onChartLegendselectchanged

}

...

<ReactEcharts

  option={this.getOption()}

  style={{height: '300px', width: '100%'}}

  onEvents={onEvents} />
有关更多事件键名称的信息,请参见:http : //echarts.baidu.com/api.html#events
opts (可选,对象)
该optsecharts的。object,将在由初始echarts实例时使用echarts.init。文档在这里。
<ReactEcharts

  option={this.getOption()}

  style={{height: '300px'}}

  opts={{renderer: 'svg'}} // use svg to render the chart.

/>
组件API和Echarts API
组件仅one API命名为getEchartsInstance。
getEchartsInstance():获取echarts实例对象,则可以使用any API of echarts。
例如:
//  使用rel渲染下面的echarts组件

<ReactEcharts ref={(e) => { this.echarts_react = e; }}

  option={this.getOption()} />
//  然后使用this.echarts_react获取`ReactEcharts`


let echarts_instance = this.echarts_react.getEchartsInstance();

//  然后您可以使用echarts的任何API。

let base64 = echarts_instance.getDataURL();
关于echarts的API,可以参见 http://echarts.baidu.com/api.html#echartsInstance。
您可以使用API执行以下操作:
binding / unbinding 事件。
dynamic charts 动态数据。
获取echarts dom / dataURL / base64,将图表保存为png。
release 图表。
————————————————
智一面|前端面试必备练习题